More than a year ago, we draw a map of the world with gnuplot. But it has been pointed out the low resolution of the map data. For example, Denmark is totally missing in the original data file. The good thing is, there is other data available in the web. In this entry we will consider how to use the physical coastline data from http://www.naturalearthdata.com/downloads/ together with gnuplot.
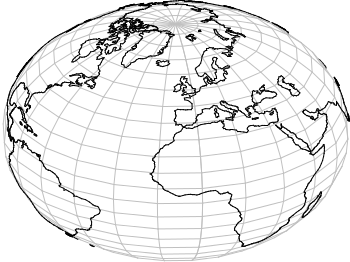
Fig. 1 Plot of the world with the new data file and a resolution of 1:110m (code to produce this figure, data)
At the download page, three different resolutions of the data are available with a scale of 1:10m, 1:50m, or 1:110m. The data itself is stored as shape files on naturalearthdata.com. Hence I wrote a script that converts the data first to a csv file using the ogr2ogr program. Afterwards the data is shaped with sed into the form of the original world.dat file.
Here are the resulting files:
- 1:10m: world_10m.txt
- 1:50m: world_50m.txt
- 1:110m: world_110m.txt
Fig.1 shows the result for a resolution of 1:110m. Note that we have to use linetype instead of linestyle in gnuplot 4.6 in order to set the colors of the grid and coast line.
In order to compare the different resolutions of the coast line files, we plot only the part of the map where Denmark is located (which is completely missing in the original data).
Here is the example code for a scale of 1:110m.
set xrange [7.5:13]
set yrange [54.5:58]
plot 'world_110m.txt' with filledcurves ls 1, \
    '' with l ls 2
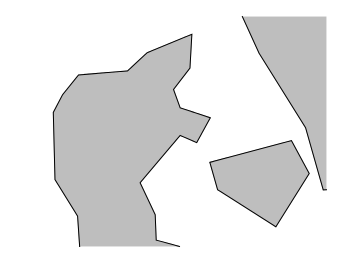
Fig. 2 A plot of Denmark at a resolution of 1:110m. (code to produce this figure, data)
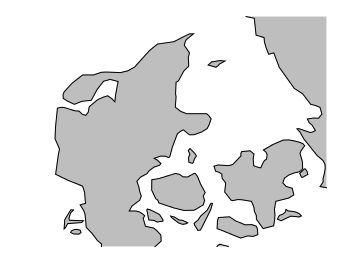
Fig. 3 A plot of Denmark at a resolution of 1:50m. (code to produce this figure, data)
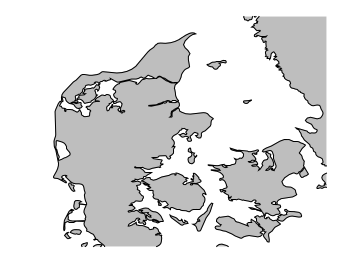
Fig. 4 A plot of Denmark at a resolution of 1:10m. (code to produce this figure, data)


